echarts图表多图例中formatter显示不正常
2021-04-12 乐帮网
echarts
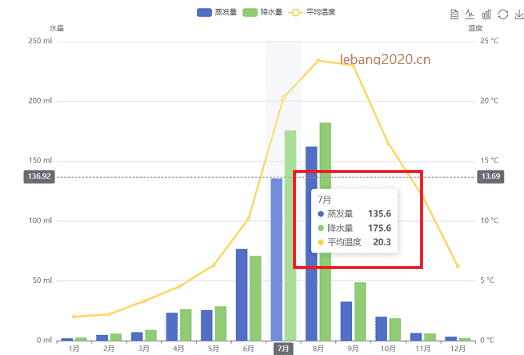
echarts图表中要显示数据的柱状图和折线图,在鼠标移动到图例上后我们需要自定义提示框。默认情况下它会使用legend + 数据做提示框,如下:
option = {
    tooltip: {
        trigger: 'axis',
        axisPointer: {
            type: 'cross',
            crossStyle: {
                color: '#999'
            }
        }
    },
    toolbox: {
        feature: {
            dataView: {show: true, readOnly: false},
            magicType: {show: true, type: ['line', 'bar']},
            restore: {show: true},
            saveAsImage: {show: true}
        }
    },
    legend: {
        data: ['蒸发量', '降水量', '平均温度']
    },
    xAxis: [
        {
            type: 'category',
            data: ['1月', '2月', '3月', '4月', '5月', '6月', '7月', '8月', '9月', '10月', '11月', '12月'],
            axisPointer: {
                type: 'shadow'
            }
        }
    ],
    yAxis: [
        {
            type: 'value',
            name: '水量',
            min: 0,
            max: 250,
            interval: 50,
            axisLabel: {
                formatter: '{value} ml'
            }
        },
        {
            type: 'value',
            name: '温度',
            min: 0,
            max: 25,
            interval: 5,
            axisLabel: {
                formatter: '{value} °C'
            }
        }
    ],
    series: [
        {
            name: '蒸发量',
            type: 'bar',
            data: [2.0, 4.9, 7.0, 23.2, 25.6, 76.7, 135.6, 162.2, 32.6, 20.0, 6.4, 3.3]
        },
        {
            name: '降水量',
            type: 'bar',
            data: [2.6, 5.9, 9.0, 26.4, 28.7, 70.7, 175.6, 182.2, 48.7, 18.8, 6.0, 2.3]
        },
        {
            name: '平均温度',
            type: 'line',
            yAxisIndex: 1,
            data: [2.0, 2.2, 3.3, 4.5, 6.3, 10.2, 20.3, 23.4, 23.0, 16.5, 12.0, 6.2]
        }
    ]
};
以上是官方的一段示例代码:https://echarts.apache.org/examples/zh/editor.html?c=mix-line-bar
我们此时可以使用formatter 来改变提示框中内容,常用的有两种方式。
(1)字符串模板
这个是最简单的方式,但是会有问题,如果我点击隐藏拆线或者柱图时,模板中的替换符合可能会找不到,如:formatter: "蒸发量: {a0}<br /> 降水量:{b0}<br />平均温度:{c0}"
(2)使用函数
 formatter: function(params){
    var str = "";
    if(params.length>0){
        var item = params[0];
        str += '<div>数据源1:'+item.value+'</div>';
    }
    return str;
}
只是抛砖引玉,可以灵活发挥,从legend中取出数据说明。最后说一下formatter 的位置,在配置项的tooltip中。完整的示例:
var option = {
        tooltip: {
          trigger: "axis",
          formatter: function(params){
            if(params.length>0){
              var item = params[0];
              return '<div>累计时长:'+item.value+ '<br />时间统计:'+item.name+'点'+'</div>';
            }
          },
          axisPointer: {
            type: "cross",
            crossStyle: {
              color: "#999",
            },
          },
        },
        toolbox: {
          show: false,
          feature: {
            mark: { show: true },
            dataView: { show: true, readOnly: false },
            magicType: {
              show: true,
              type: ["pie", "funnel"],
              option: {
                funnel: {
                  x: "25%",
                  width: "50%",
                  funnelAlign: "center",
                  max: 1548,
                },
              },
            },
            restore: { show: true },
            saveAsImage: { show: true },
          },
        },
        calculable: false,
        legend: {
          data: ["柱形", "折线"],
        },
        xAxis: [
          {
            type: "category",
            data: this.piedata.xAxisData,
            axisPointer: {
              type: "shadow",
            },
          },
        ],
        yAxis: [
          {
            type: "value",
            name: "累计时长(小时)",
            min:this.piedata.minValue,
            max:this.piedata.maxValue,
            interval:this.piedata.intervalValue,
            axisLable:{
              formatter:'{value} 起'
            }
          },
        ],
        series: [
          {
            name: "柱形",
            type: "bar",
            data: this.piedata.seriesData,
          },
          {
            name: "折线",
            type: "line",
            data: this.piedata.seriesData,
          },
        ],
      };

关注我的微信公众号
在公众号里留言交流
投稿邮箱:1052839972@qq.com
庭院深深深几许?杨柳堆烟,帘幕无重数。
玉勒雕鞍游冶处,楼高不见章台路。
雨横风狂三月暮。门掩黄昏,无计留春住。
泪眼问花花不语,乱红飞过秋千去。

如果感觉对您有帮助
欢迎向作者提供捐赠
这将是创作的最大动力